Chapter 5: Sampling Distribution
Definition Sheet:
-
Population
- Collection of all possible outcomes of our experiment
-
Sample
- Collection of observations from the population
- X1, X2, … Xn
-
Random Sample
- A set of independent observations
-
Statistic
- A function of one or more random variables
Statistics will be concerned with
- Sample Mean
- Sample Variance
Sample mean and Sample Variance are random before we take our observations…
After we’ve taken our random sample, we know X1, X2, … Xn, and we get
Which is a realization of x̄
and
Which is a realization of S2
One other little note...
Xi has a sample mean as well, but would be quite a bit harder to find. If you were calculating height of a series of students for example, the sample mean of the group of students would be x̄ for example.
However, this isn’t representative of EVERY student on the planet, or the ENTIRE Population. You would need to find the sample mean (μ) of Xi for that.
If I repeat the process, and observe another set of observations, I’ll get a new X1, X2, … Xn, and a new x̄ and S2
Example One

μx = E(xi) 100Ω σ = 10Ω N = 25 We know this is a Random Distribution (follows a normal distribution) Let Xi = X of I resistor


Remember, Φ is pulled from a lookup table.
Example Two

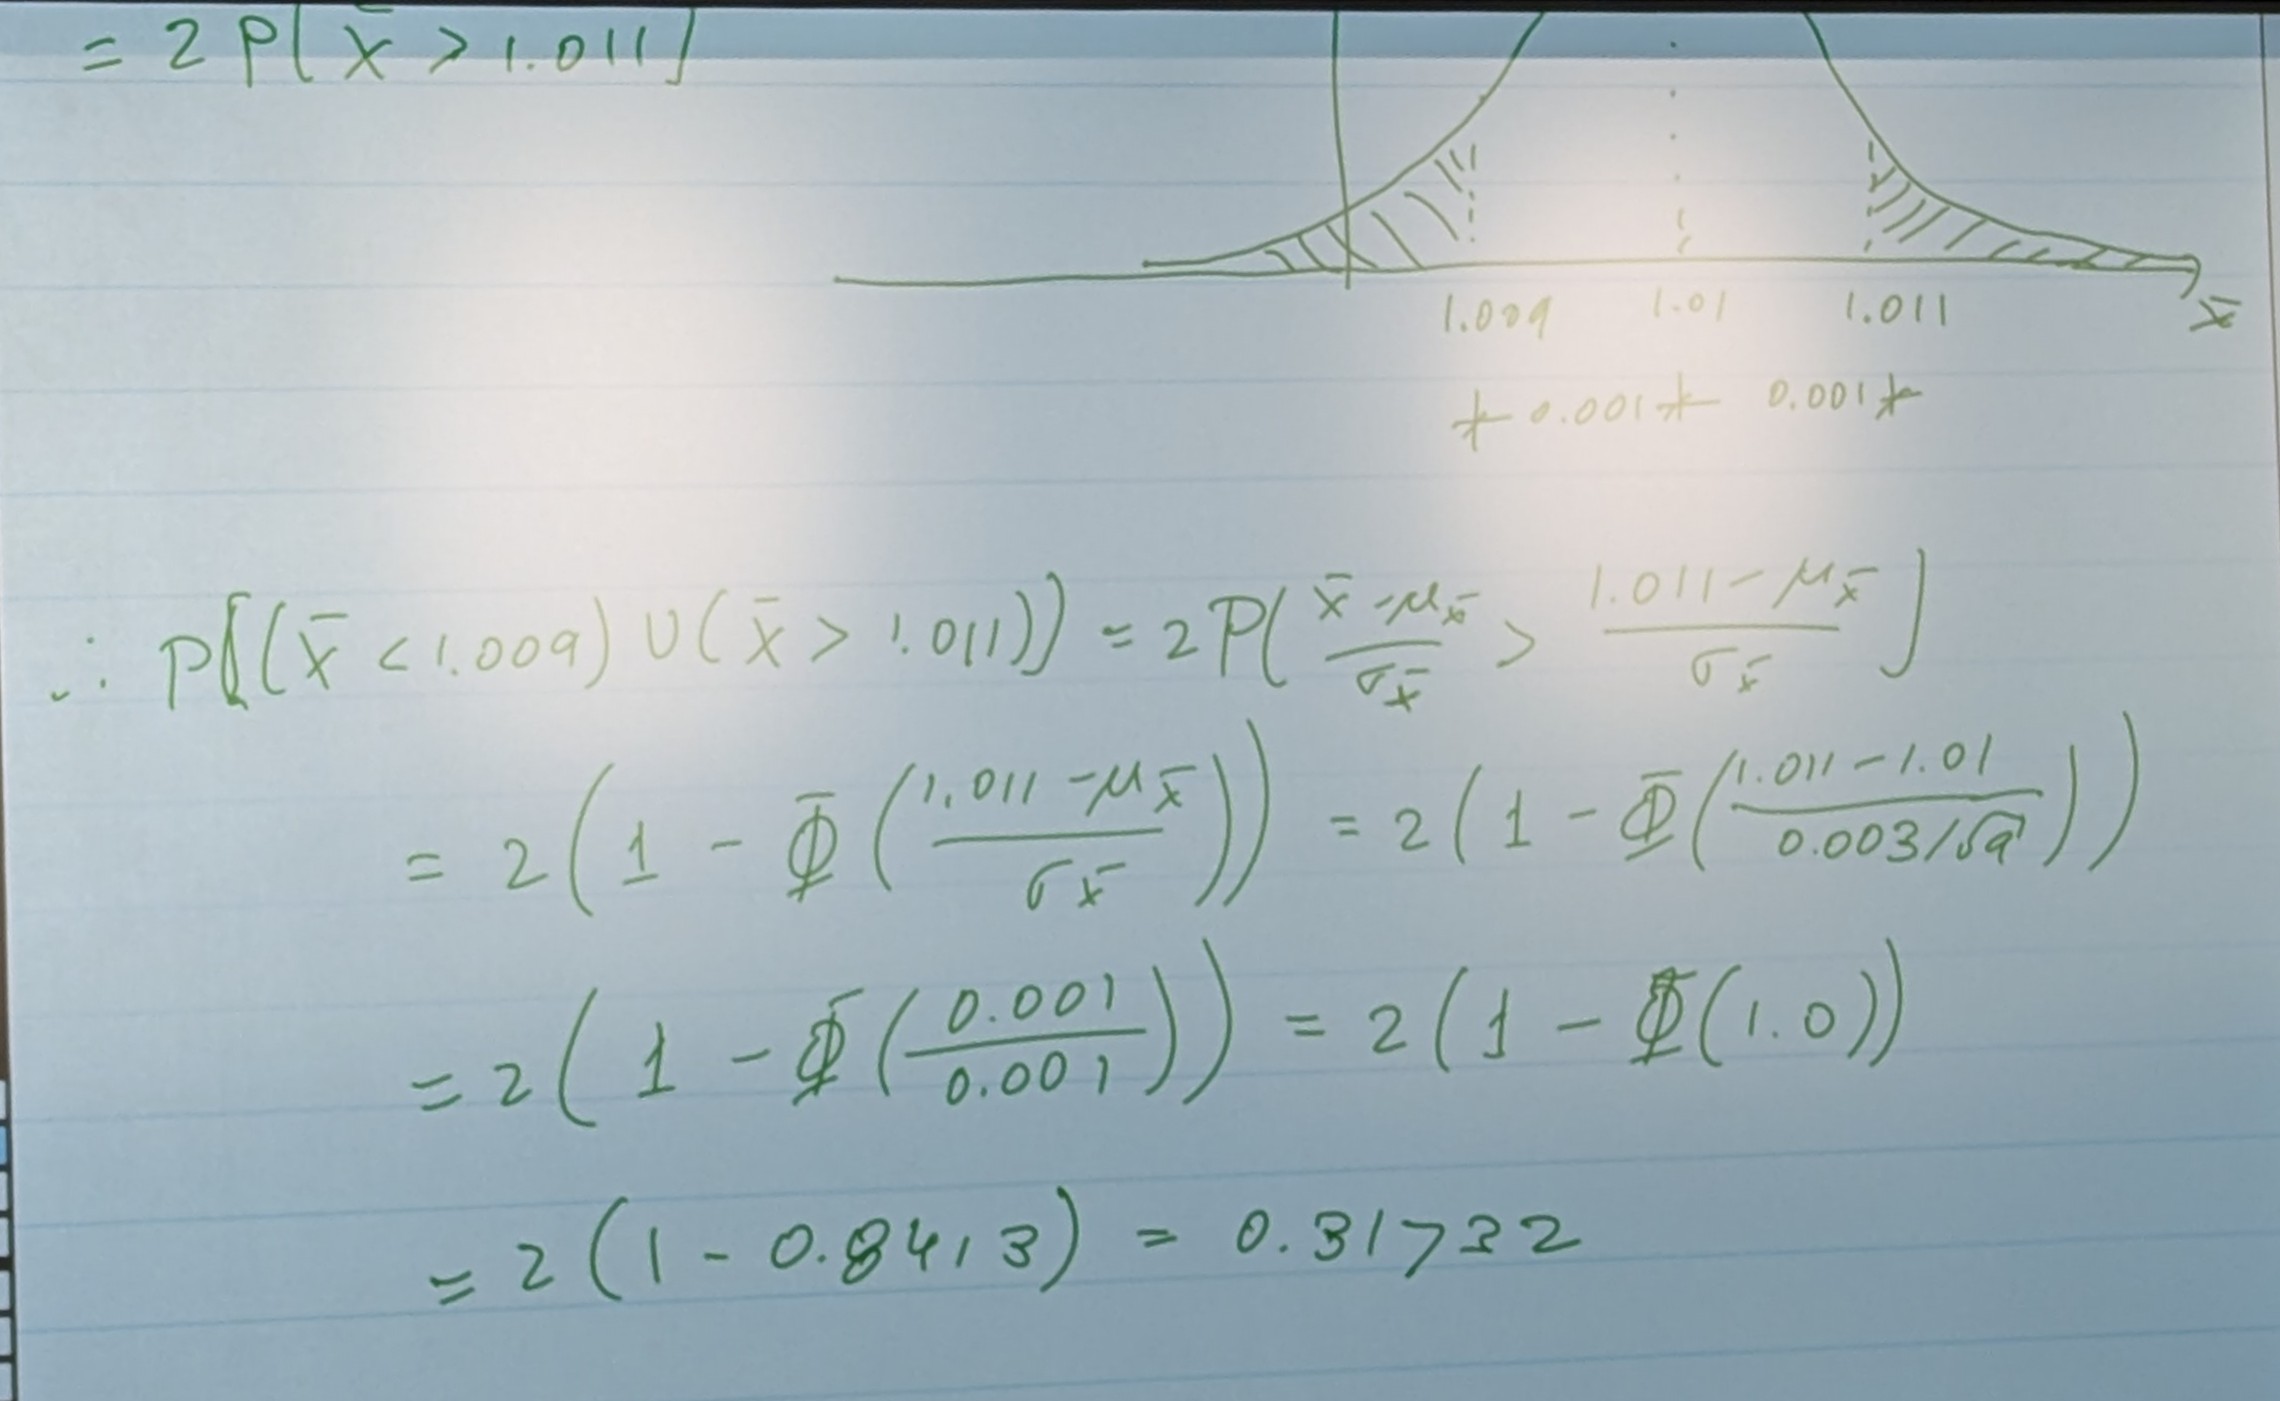
μx = E(xi) 1.01 σ = 0.003 N = 9 (Here, we have to assume “Random Samples”. Otherwise, this isn’t doable.) We know this is a Random Distribution (follows a normal distribution)
We want to find:
P((x̄ < 1.009) U (x̄ > 1.011))
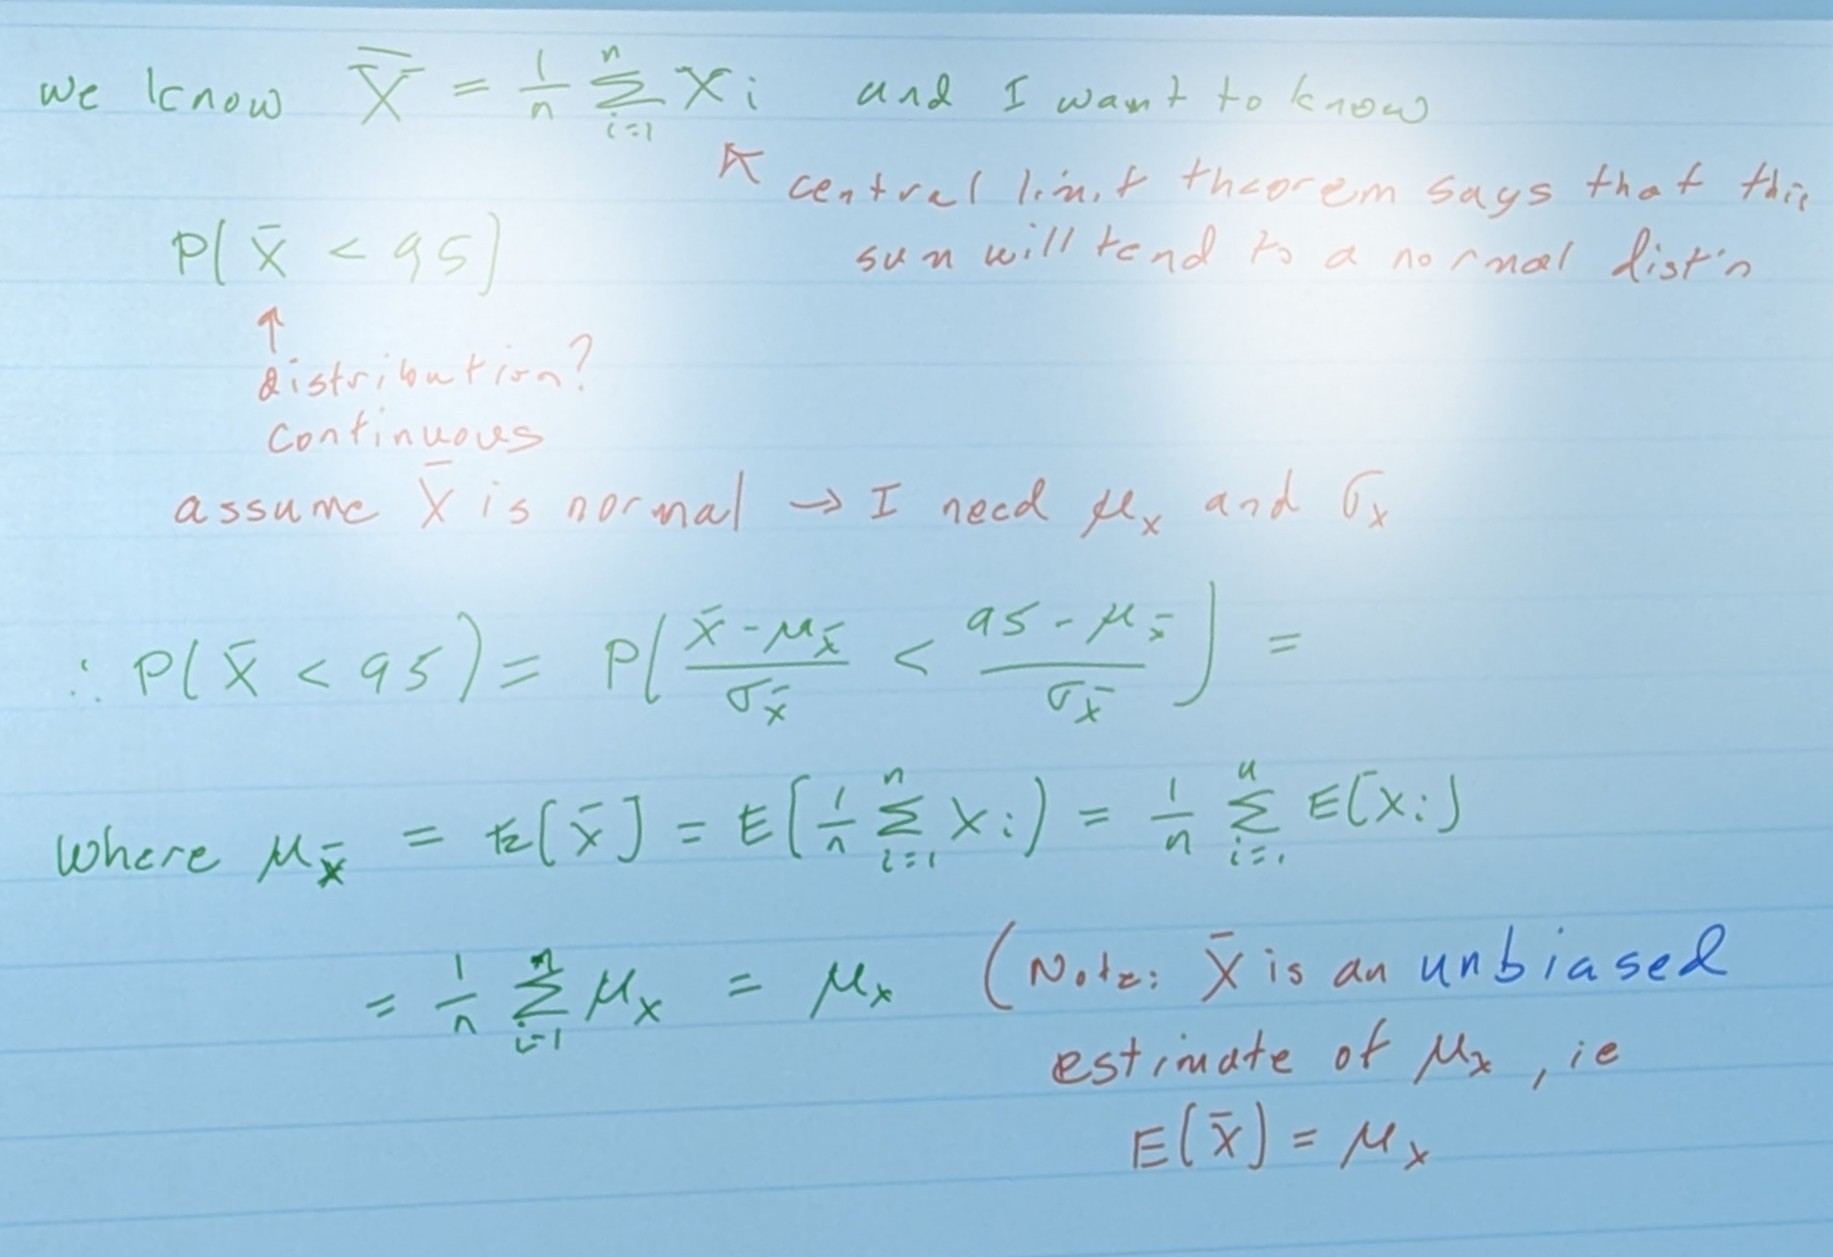
Distribution? We need; μx̄ and σx̄
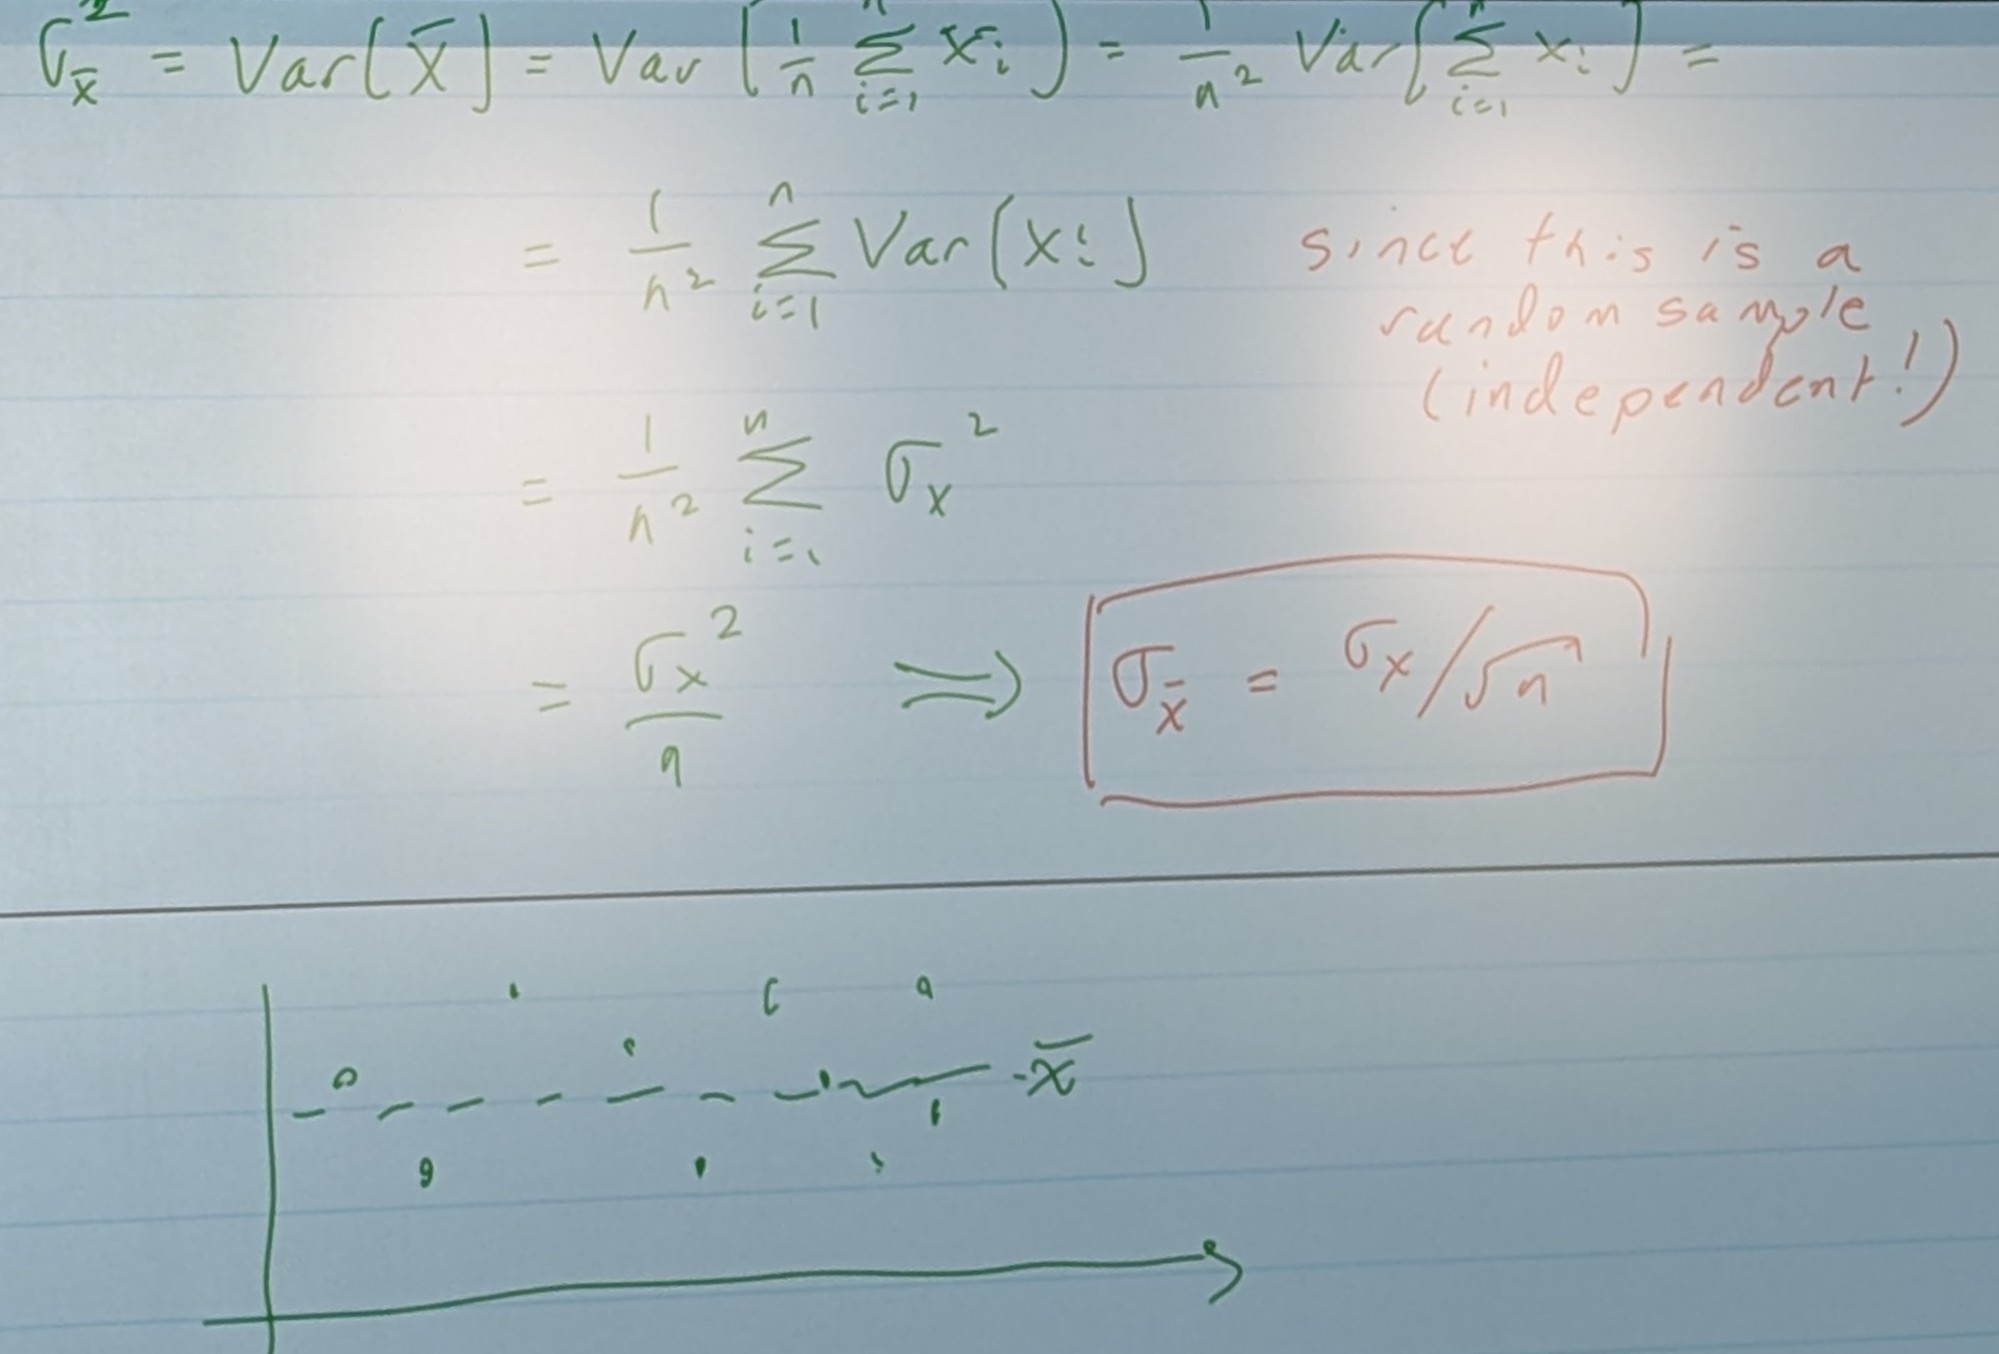
μx̄ = μx, σx̄ =
Here, we’ll find the probability for one half of the curve, and then double it (because they are the same thing on each side)

Now, what happens if I don’t know σx?
We must now estimate σx with Sx
where Sx2 =
So, our standardization now becomes:
