Geometric Series, Cont’d
A reminder about Geometric Series
Let T1 = Number of trials until the first (or next) “success”
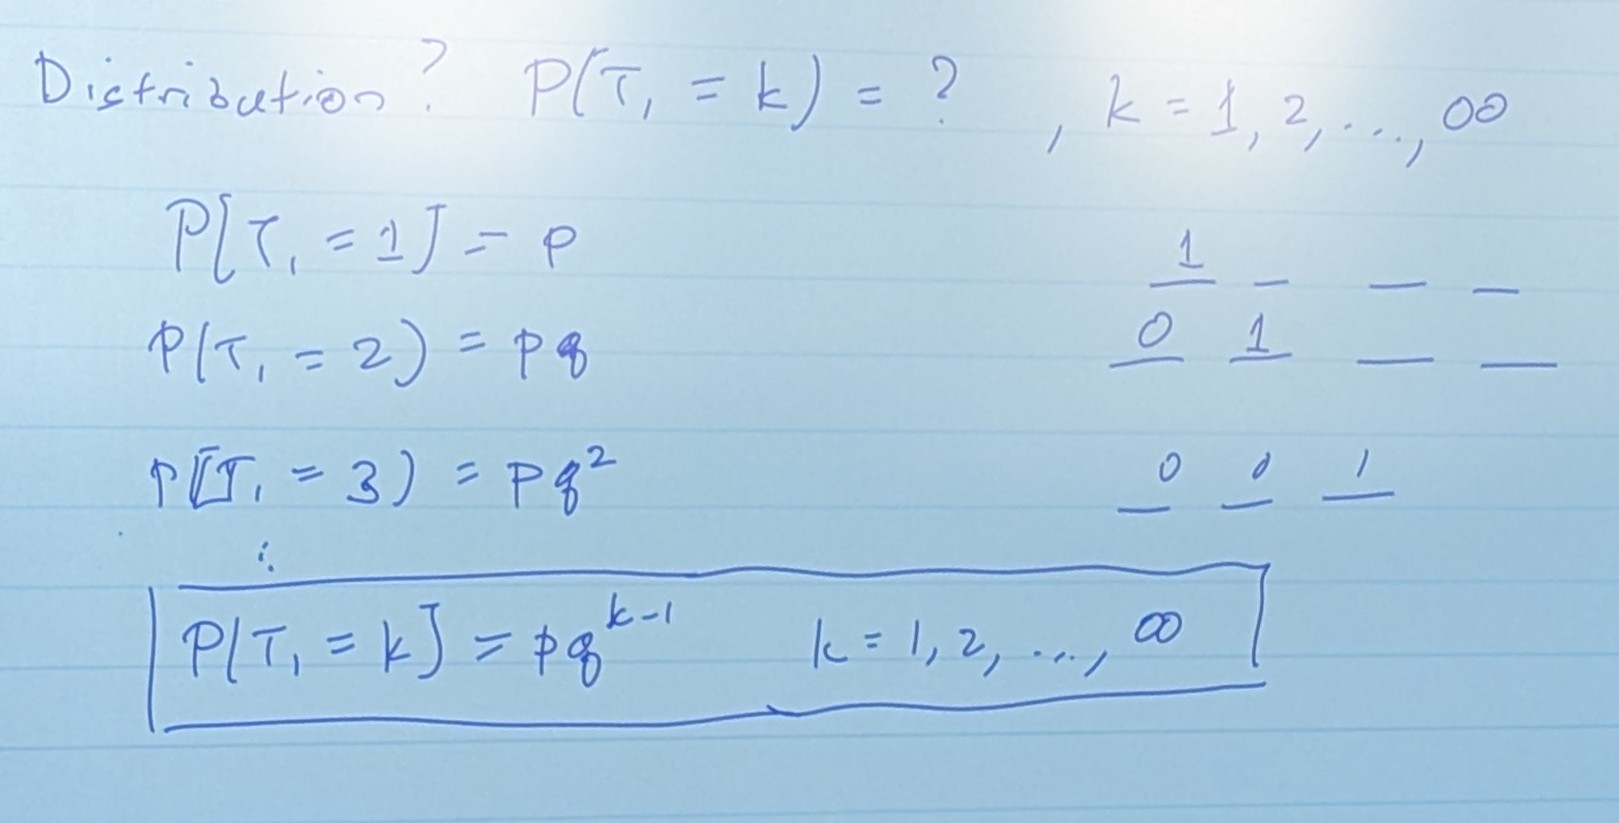
Distribution?
P(T1 = K) = ?, K = 1,2,… , ∞
To make this easier, the expected value is just.
When is the expected next time that something will happen given the probability?
For variance, it’s a little bit more non-sensible.
Example One

- How shall we model this?
Let’s assume each year is a trial, and each trial will have a a max wind which either exceeds, or doesn’t the “50-year windspeed” (E(T1) = 50)
Let Xi be 1 if our windspeed exceeds the 50 year value, and 0 if it does not.
Note
Often times, you’ll be given an expected time, and not directly a probability. You’ll just have to flip it like I did above.
A) We want P(T1 = 5) (F, F, F, F, S)
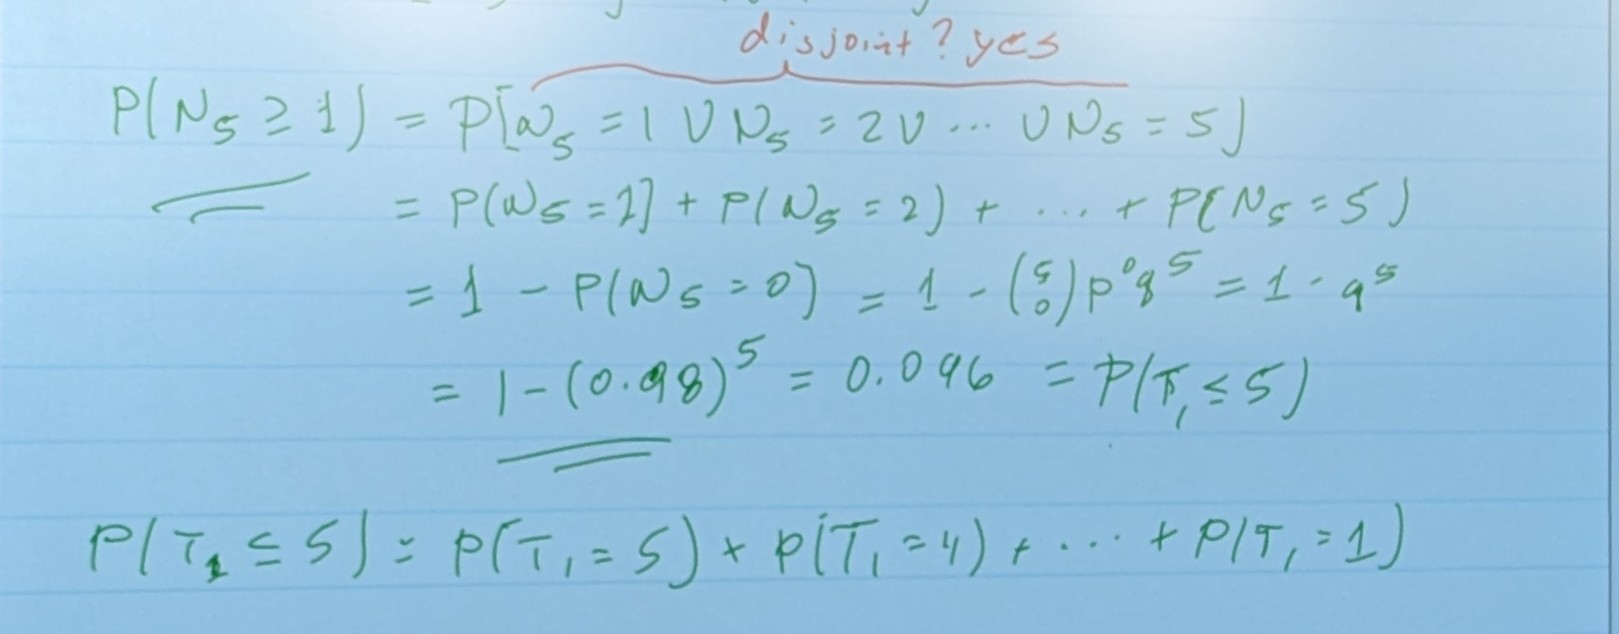
B) We want P(N5 ≥ 1 ) = P(T1 ≤ 5 ) (F,S,F,F,F)

Negative Binomial
Let Tk = Number of trials until the kth “success”
Distribution?
P(Tk = m) = ?, M = k, k+1,… , ∞
This is pretty similar to Geometric! If
K =1, then it really is the same. It’s a generalization.
M = Number of Trials K = Number of Successes in M Trials
And the variance of Tk is
And the expected value is
Example Two
In the transmission tower problem from above, what is the probability that the second 50 year wind will occur in the 5th year of service?
We want P(T2 = 5)
Now, let’s do something fun.
The Rate of Success, Poisson Distributions
Lets let every instant in time become a Bernoulli Trial. Now, “successes” can occur at any instant

Problems: Let Nn equal the number of “successes” in time t (?) N > ∞ on any time interval
If P > 0

We need to replace P with a mean rate of “successes”, λ (number per unit time)
Let Nt = Number of “successes” in time T (discrete)
Poisson Distribution
This is the analog to the binomial distribution (Nn = number of successes )
and of course…
Expected Value
Variance

